What does this have to do with sleep?
The technology Berger used in the 20’s was Electroencephalography or EEG. To perform an EEG a practitioner places 8-16 pairs of electrodes on specific areas of your cranium and measures electrical activity.
The difference in activity between one electrode and another is translated to a line which the practitioner can then use to determine what your brain is doing, and because the lines created by these machines adopt a wave like structure, the term brainwaves has been coined. It was thanks to the electrical nature of neuron to neuron communication that we were able to measure brain activity and it was because of this activity that we were able to start to study sleep in far more detail. So how is this measured?
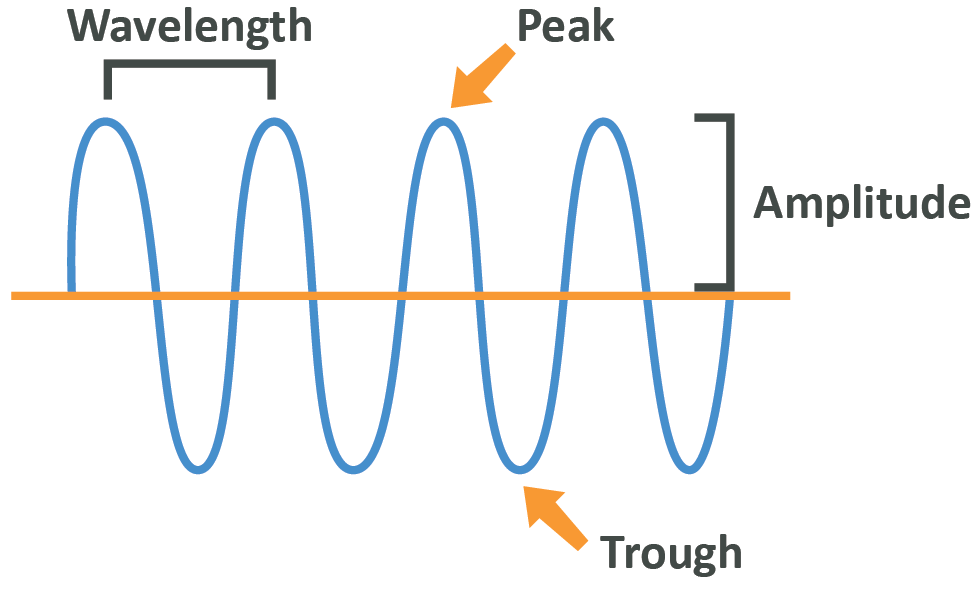
Electrical waves like the example above are measured in two dimensions:
- Amplitude, which is the difference between the peak of a wave and the centre line, and it measures the power of the wave – in soundwaves the amplitude measures the disturbance in the atmospheric air pressure and in water the amplitude would be the height of the wave. Amplitude is denoted by the symbol µV
- Frequency or wavelength is measured in hertz (Hz), and it denotes the number of cycles between peak and trough per second. The higher the frequency, the more often a peak or trough will occur in a given time period
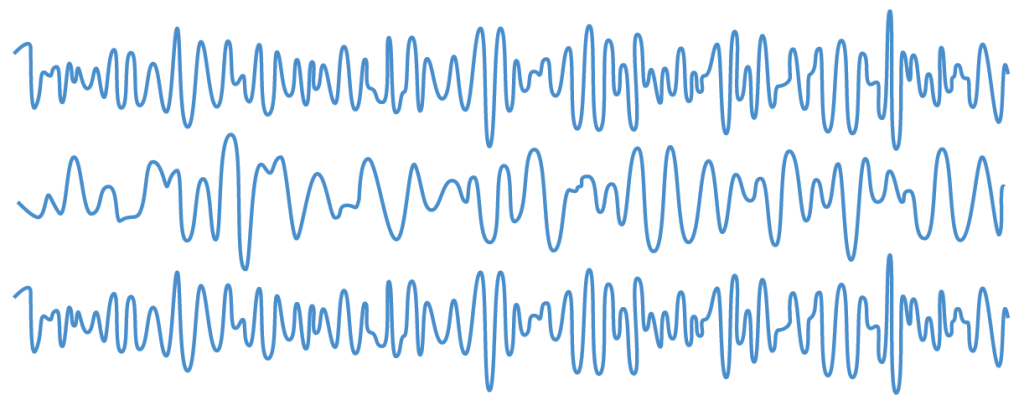
EEG machines measure the amplitude and frequency of electrical signals in the brain and transfer them to a printout sheet which looks like the below, and it is by studying these that researchers can reach conclusions about what is occurring in your brain during the night.
Note: Fig. 66 is used to give you an idea of how EEG readouts appear. Note that true EEG measurements would contain many more lines of data.